October 23, 2013
By: Greg Simon, Contributor from www.knowmadiclife.com
“’The folks in the middle and at the bottom haven’t seen wage or income growth, not just over the last three, four years, but over the last 15 years,’” the president said.”
— http://money.cnn.com/2013/09/15/news/economy/income-inequality-obama/

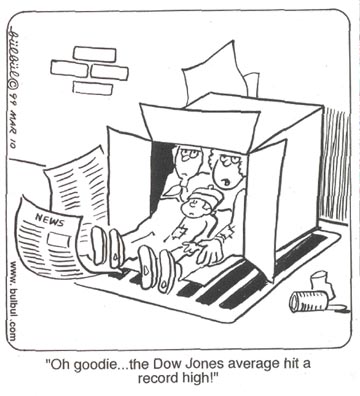
Printing money, or money supply inflation, causes the value of each unit of money to decline. This decline in value is manifest as falling real wages and rising prices. People who own assets become wealthier as the nominal value of their assets increases. Furthermore, because the wealth gains are coming from asset price appreciation no amount of income tax hikes will make a difference. Income taxes could be raised to 100% with still no impact on this gain in wealth. People who do not own assets become poorer as the real value of their wages declines and their cost of living increases. Printing money does not create wealth. It redistributes existing wealth. It is a covert wealth redistribution from the poor to the rich.
How have prices reacted to QE since 2009?
One gallon of gasoline in 2009: $2.50
One gallon of gasoline in 2013: $3.50
A $1.00 increase, or +10% annual price inflation.
Source data is here.
One pound of coffee in 2009: $3.66
One pound of coffee in 2011 (latest data available): $5.23
A $1.57 increase, or +21% annual price inflation.
Source data is here.
Cost of health care in 2009: $16,771
Cost of heath care in 2013: $22,030
A $5259 increase, or +8% annual price inflation.
Source data is here
Real average hourly earnings 2009: $8.50
Real average hourly earnings 2013: $8.78
A $0.28 increase, or +0.8% annual price increase.
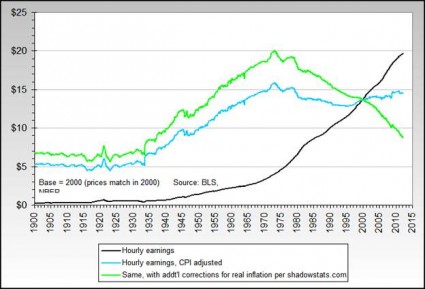
Note: these real average earnings numbers are calculated using the current BLS CPI-U formula. This formula does not measure the change in prices as previous BLS CPI formulas have done. The current BLS CPI formula measures the change in the cost of living assuming substitution of goods and using hedonic pricing. If the previous BLS CPI formulas that did measure the change in prices were used real average earnings would be falling by approximately -5% (for more information click here). As we can see in the above chart from Shadowstats.com, when the previous the BLS CPI formulas which do not assume substitution of goods nor use hedonic pricing are applied we can see real wages have been continuously falling for 40 years since peaking out in 1972.
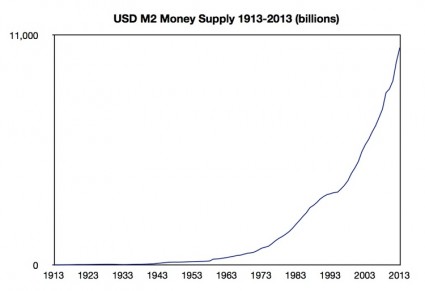
USD M2 Money supply 2009: $8.2 trillion
USD M2 Money supply 2013: $10.9 trillion
A $2.7 trillion increase, or +6.5% annual money supply inflation
Source data is here

S&P 500 in 2009: 683
S&P 500 in 2013: 1750
A $1067 increase, or +39% annual price inflation.
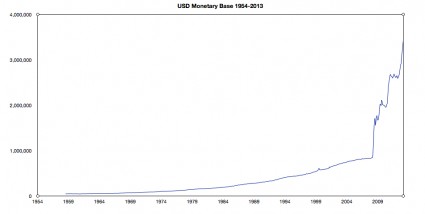
Money supply inflation began to accelerate in the late 1960s which motivated the Federal Reserve to remove the US dollar from gold backing in 1971 replacing it with US Treasury backing. Not surprisingly, as we saw above, the following year in 1972 real wages in the USA peaked out and have been on a steady 40 year decline since. QE is money supply inflation as we detailed in this July 10th note titled, “The Fed Has Lost Control and QE Has Failed”. QE is money supply inflation on steroids increasing the monetary base a mind boggling $1 trillion every year. If QE can never end, as we explained in this September 18 note, “No Fed Taper Confirms: R.I.P. US Dollar”, then the below trend would have to be sustainable. Is the below trend sustainable?
The Federal Reserve believes QE is the solution to fixing the US economy because it believes re-inflating asset values to levels that match the total debt outstanding will ease the burden of that debt on the economy. What the Fed fails to realize is the money supply inflation required to inflate asset values causes both the cost of living for Americans and cost of doing business in America to rise. The excessive debt in the economy keeps mal-investment locked in place and therefore the cost of capital artificially high. As the value of money declines people become poorer and business profits erode. The economy enters a period of stagflation, or price inflation with no real growth. The Federal Reserve is making people poorer, not wealthier. The Federal Reserve’s solution makes the problems worse, not better.
The solution is not to inflate the assets. The solution is to liquidate the debt. Liquidating the debt deflates the money supply. Asset prices decline as does the cost of living. Real wages stop declining and begin to rise. The middle class can begin to save and build wealth again. As prices fall the cost of doing business falls and businesses expand. Mal-invested capital is freed up from industries not supported by real consumer demand to industries that are supported by real consumer demand stimulating real sustainable growth in the economy. Interest rates will rise encouraging savings over consumption. People become wealthier and the economy enters into a period of sustained real economic growth. As asset values fall and real wages rise the wealth gap not only will stop growing but it will begin to reverse. A strong American middle class will reemerge once again. Is this not what the democrats claim to be for?
Greg Simon is an investment banker turned world traveler. Upon realizing the inherent folly within the banking system, he left his career to better his understanding of people, linguistically diversify, and educate folks about what he has come to understand about the banking system as well as solutions to protect wealth and assets. He can be contacted here.


