
The short answer: the United States is far ahead with 23.6 million millionaires, followed by Mainland China with 5.3 million and Japan with about 2.9 million.
If you just want the ranking, here it is:
- 1. United States – 23,627,000
- 2. Mainland China – 5,305,000
- 3. Japan – 2,902,000
- 4. France – about 2.39 million to 2.63 million
- 5. United Kingdom – 2,390,318
- 6. Germany – 2,369,770
- 7. Canada – about 2,098,000
- 8. Australia – about 1,634,000
- 9. South Korea – 1,317,000
- 10. Italy – about 1,235,000
But raw count only tells part of the story.
If I zoom out, three things stand out:
- The U.S. dominates by scale, holding about 41% of the world’s 57.5 million millionaires.
- China is a distant second, with a large pool of wealth but much less spread across the population.
- Countries like Canada and Australia stand out on median wealth, which gives you a better sense of how wealth is spread beyond the top tier.
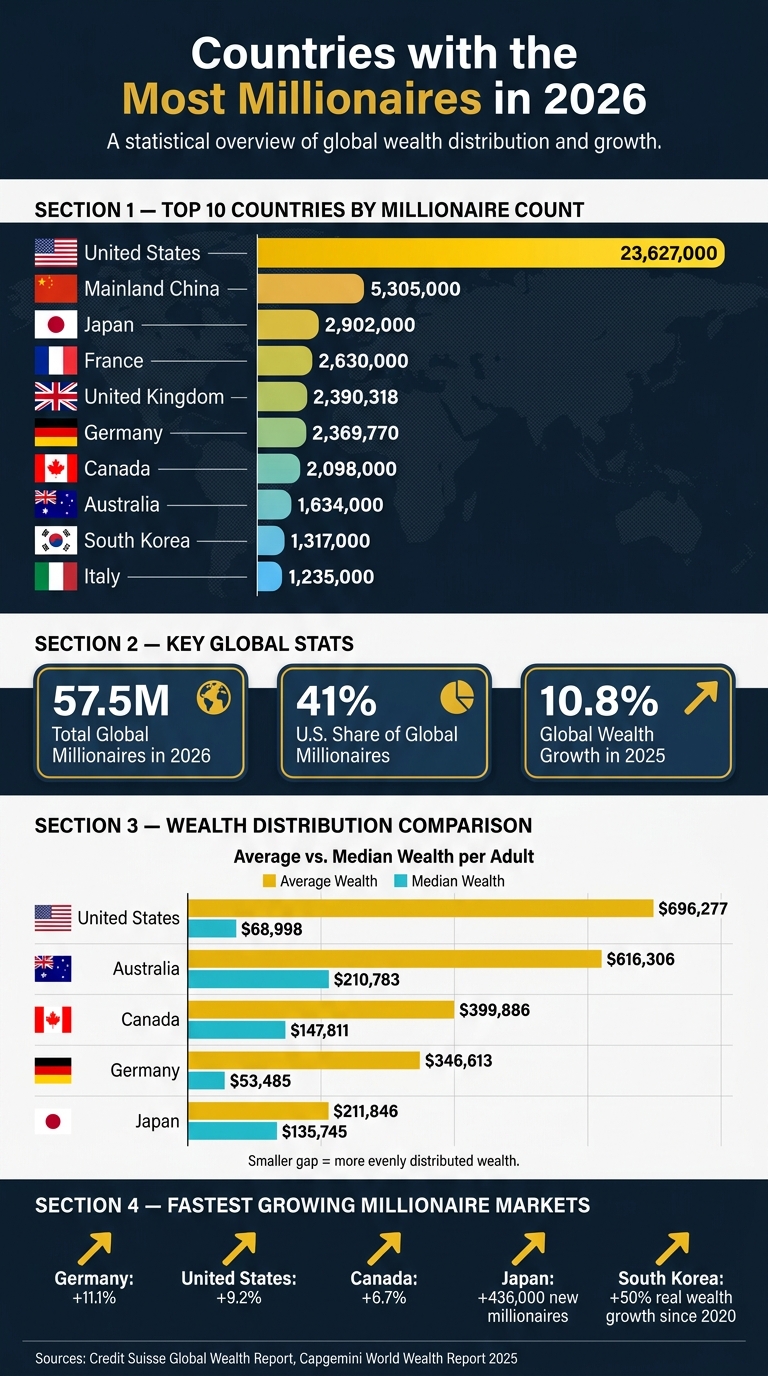
Quick comparison
| Country | Millionaires | Global position | Simple takeaway |
|---|---|---|---|
| United States | 23,627,000 | 1 | By far the biggest millionaire base |
| Mainland China | 5,305,000 | 2 | Large wealth pool, still far behind the U.S. |
| Japan | 2,902,000 | 3 | Big and more evenly spread than many peers |
| France | 2.39M–2.63M | 4 | Large European wealth center |
| United Kingdom | 2,390,318 | 5 | Slightly ahead of Germany |
| Germany | 2,369,770 | 6 | Very close to the UK |
| Canada | 2,098,000 | 7 | High median wealth and a broad middle |
| Australia | 1,634,000 | 8 | High wealth per adult |
| South Korea | 1,317,000 | 9 | Fast growth in recent years |
| Italy | 1,235,000 | 10 | Large base with solid median wealth |
Bottom line: if you’re asking which country has the most millionaires in 2026, the answer is the United States by a huge margin. If you’re comparing wealth systems, though, you also need to look at density, median wealth, and recent growth.
sbb-itb-39d39a6
1. United States
The United States leads the world with 23,627,000 millionaires. That works out to about 41% of the global total and roughly 4.5 times China’s 5.3 million.
Millionaire Density
The raw number is huge, but wealth per adult paints a different picture. By that measure, the U.S. ranks 28th in median wealth at $68,998. So yes, the country has a massive millionaire population, but that wealth is spread unevenly.
Recent Growth Trend
The U.S. added more than 440,000 new millionaires in 2025. That’s nearly half of all new millionaires created around the world that year, or more than 1,200 a day.
The millionaire population grew by 9.2% in 2025 alone. Over the decade from 2014 to 2024, it grew by 78%, slightly ahead of China’s 74% over the same stretch. A few forces help explain that pace: strong financial markets, a booming tech sector, and broad stock ownership. In 2025, about 62% of American adults owned stocks, either directly or through retirement accounts.
This lead isn’t standing still. It’s getting larger. China is still the only country that comes close to the U.S. in total millionaire count, but the distance between them remains large.
2. Mainland China
Mainland China ranks second, with about 5,305,000 millionaires. That works out to 9.1% of the global total. It’s still far behind the U.S., but ahead of Japan, which has roughly 2.6 million millionaires.
At the same time, China sits outside the top 30 for average and median wealth per adult. That tells a pretty clear story: millionaire wealth is concentrated in a smaller slice of the population, not spread broadly across the country.
Millionaire growth in China is still strong, although the exact pace depends on the source. And while Asia-Pacific kept growing, the region still lagged behind the Americas in 2025 growth.
In the $1 million to $5 million bracket, residential property still makes up the biggest share of wealth. That said, liquid assets have taken a larger share over the past decade.
3. France
Total Millionaire Count
France has about 2.39 million millionaires, and some 2026 estimates put that figure closer to 2.63 million. That keeps France among the world’s biggest wealth hubs and firmly near the top of the global ranking.
Share of Global Millionaires
France makes up about 4.15% of the world’s 57.5 million millionaires.
Millionaire Density
France’s average wealth per adult stands at $341,359, while median wealth is $121,898. That gap points to more wealth sitting near the top than in many similar economies.
The U.S. shows an even sharper split. There, average wealth per adult is $696,277, while median wealth is $68,998.
Recent Growth Trend
France’s millionaire population grew 2.7% in 2025, which signals steady but moderate growth. Next is Japan, another mature wealth market with a smaller millionaire base.
4. Japan
Total Millionaire Count
Japan has 2,902,000 millionaires at the end of 2025, which makes it the third-largest millionaire hub in the world, behind the United States and Mainland China. That works out to about 5% of the world’s 58 million millionaires.
Millionaire Density
Japan’s wealth picture is more balanced than in many other major markets. Average wealth per adult is $211,846, while median wealth is $135,745. Those two figures sit much closer together than they do in the U.S., where average wealth is $696,277 and median wealth is $68,998.
What does that mean in plain English? Japan has a broad millionaire base. It’s not just a small top tier pushing the average up while everyone else sits far below it. The gap between average and median wealth is narrower, which points to a more even spread of wealth across the population.
Recent Growth Trend
Japan added 436,000 new millionaires in 2025 alone. Part of that jump came from Asia-Pacific’s 5.9% wealth growth and a weaker U.S. dollar, which pushed yen-based assets higher when measured in dollar terms.
There’s also a longer-term shift worth noting. More wealth is moving into liquid, investable assets instead of staying tied up in residential property, and that is helping support future wealth growth.
Next comes Germany, another major wealth market with a smaller millionaire base.
5. Germany
Total Millionaire Count
Germany has 2,369,770 millionaires in 2026, which puts it sixth in the world. It sits just behind the United Kingdom, which has 2,390,318. The gap is small, so these two countries are almost tied.
That also puts Germany in the same top group as Europe’s biggest wealth centers.
Share of Global Millionaires
Germany makes up about 4.1% of the world’s 57.5 million millionaires. And the wealth picture doesn’t stop there. The country also has 315 billionaires, with major wealth clusters in Munich and Frankfurt.
Millionaire Density
By headcount, Germany looks strong. But once you compare average and median wealth, the picture changes.
Average wealth per adult is $346,613, which ranks 14th globally. Median wealth per adult is $53,485, which ranks 30th globally. That’s a pretty clear gap. In plain English, a lot of wealth sits near the top, while the middle of the distribution is less deep.
Recent Growth Trend
Germany’s millionaire population grew by 11.1% in 2025. That was well above Europe’s average and far ahead of the Asia-Pacific pace.
A big part of that came from steadier equity markets and lower inflation pressure. Wealth growth was concentrated in automotive manufacturing, including BMW, Mercedes-Benz, and Volkswagen.
The United Kingdom still stays ahead, but only by a slim margin, which makes the next comparison especially close.
6. United Kingdom
Total Millionaire Count
The United Kingdom sits just ahead of Germany by a slim margin. In 2026, the UK has 2,390,318 millionaires, which puts it fifth in the world. In Europe, only Germany ranks above it.
Share of Global Millionaires
The UK makes up about 4.1% of the world’s millionaires. It also has 108 billionaires and 1,209 people with more than $100 million.
Millionaire Density
For a large economy, wealth in the UK is spread a bit more evenly than in some other countries. Average wealth per adult is $292,808, which ranks 21st worldwide, and median wealth per adult is $125,335, which ranks 13th.
That gap between average and median wealth is smaller than it is in the U.S. Put simply, wealth in the UK is less concentrated at the very top than in the U.S.
Recent Growth Trend
The UK’s millionaire population grew by 2.6% in 2025. That was slower than Germany’s 11.1% and the U.S.’s 9.2%, but almost in line with France’s 2.7%. A weaker U.S. dollar also pushed UK wealth figures higher when measured in U.S. dollar terms.
So the UK remains a major wealth hub, even if recent growth has lagged behind the U.S. and Germany. Canada comes next.
7. Canada
Canada sits just behind the UK in total millionaire count, but the bigger story is how wealth is spread. It isn’t as top-heavy as it is in some other rich countries.
Total Millionaire Count
Canada ranks 7th globally with about 2,098,000 millionaires. A lot of that wealth sits in Toronto and Vancouver. And for many Canadian millionaires in the $1 million to $5 million range, residential property still does much of the heavy lifting.
Share of Global Millionaires
Canada makes up about 3.6% of the world’s 57.5 million millionaires.
Millionaire Density
This is where Canada stands apart. Average wealth per adult is $399,886, which puts the country 13th worldwide. Median wealth per adult is $147,811, good for 7th place globally.
That gap matters. Average wealth shows the top end, while median wealth gives a better read on the middle. In Canada’s case, the numbers point to wealth being spread more evenly across the population. The contrast with the United States is pretty clear: average wealth there is $696,277, but median wealth is just $68,998.
Recent Growth Trend
Canada’s millionaire population grew by 6.7% in 2025, adding about 30,000 millionaires. Strong equity markets and easing inflation helped drive that growth. It also keeps Canada firmly in the upper tier of global wealth hubs.
8. Australia
Australia ranks 8th globally by total millionaire count.
Total Millionaire Count
As of 2026, Australia has about 1,634,000 millionaires. It also has around 98,656 people with assets above $5 million and 99 billionaires living in the country.
Share of Global Millionaires
Australia makes up about 2.8% of the world’s 57.5 million millionaires. That puts it just behind Canada and ahead of South Korea in the global ranking.
Wealth per Adult
Australia’s wealth base runs deep. It’s not only about a small group at the top.
Average wealth per adult is $616,306, which ranks 5th globally. Median wealth tells an even stronger story: $210,783 per adult, good for 3rd in the world.
That relatively small gap between average and median wealth suggests money is spread more evenly than in many other countries. The contrast with the United States is pretty stark. In the U.S., average wealth is $696,277, but median wealth falls to $68,998, which ranks 28th globally. Australia’s two figures sit much closer together.
For people looking at places where wealth is both deep and broadly distributed, Australia stands out as a major hub for globally mobile investors.
Recent Growth Trend
Australia added 18,100 new millionaires in 2025. Growth is steady rather than fast, but the country’s broad wealth base keeps it firmly in the top group of global wealth hubs.
South Korea comes next, with a smaller millionaire base in Asia.
9. Italy
Italy is a mature European wealth market. It’s smaller than France or Germany, but its median wealth stands out. In 2026, Italy has about 1,235,000 millionaires, which puts it 11th globally and 5th in Europe.
Millionaire Density
Italy’s wealth picture is fairly balanced. Average wealth per adult is $279,439, while median wealth is $131,001. That gap is much narrower than in the U.S..
Recent Growth Trend
Italy’s millionaire count climbed from 289,300 in December 2023 to more than 1.2 million in 2026. One big reason: a weaker U.S. dollar pushed euro-denominated wealth higher when measured in dollar terms.
South Korea follows, with a smaller but still notable millionaire base in Asia.
10. South Korea
South Korea ranks ninth worldwide with 1,317,000 millionaires in 2026, or about 2.3% of the global total. That figure isn’t just about a small wealthy class at the top. It also reflects a fairly broad spread of wealth across households.
Millionaire Density
Average wealth per adult stands at $311,260, while median wealth is $101,739. That gap still shows inequality, of course, but it also points to a wider base of wealth than you see in more top-heavy markets.
Recent Growth Trend
South Korea stands out as the fastest-growing market in this group. Since 2020, real average wealth has climbed by more than 50%, beating every other market in the set, including Norway, Taiwan, and several European countries. On top of that, a weaker U.S. dollar in 2025 gave extra support to Korean assets when measured in U.S. dollars.
Most of that wealth growth still ties back to housing. Residential property remains the main driver of household wealth, though the mix is starting to shift. Liquid assets are taking up a larger share over time.
Wealth Concentration and Growth: How the Top Countries Compare
Scale still matters. The U.S. is still the clear leader by total count. But Canada sits much higher on median wealth, which points to a broader spread of wealth across the population. For investors comparing jurisdictions, that can matter more than the raw number of wealthy people.
Once you look at density, the ranking shifts. Switzerland, Luxembourg, and Singapore move ahead of many larger countries. They don’t lead on total count, but they do stand out for wealth density and their pull on global capital. Switzerland has the highest average wealth per adult at $910,382. Luxembourg ranks first in median wealth at $394,005 and posted a 13.5% jump in its HNWI population in 2025, with about 1 in 6 adults holding millionaire status. These hubs attract wealthy investors far beyond what their population size would suggest, helped by tax advantages, asset protection, and privacy.
Global personal wealth increased 10.8% in 2025, with Asia-Pacific and North America leading the move.
The table below lines up the top 10 countries with a few key reference hubs. It shows why total count, density, and growth can tell very different stories:
| Country | Total Count Rank | Density Snapshot | Growth Direction |
|---|---|---|---|
| United States | 1 | Avg. $696,277 | Mature / Steady |
| Mainland China | 2 | High concentration, >$5M tier | Rapidly maturing |
| France | 3 | Avg. $341,359 | Stable, 2.7% |
| Japan | 4 | Avg. $211,846 | Accelerating |
| Germany | 5 | Avg. $346,613 | Strong, 11.1% |
| United Kingdom | 6 | Avg. $292,808 | Stable, 2.6% |
| Canada | 7 | Avg. $399,886 | Balanced, 6.7% |
| Australia | 8 | Avg. $616,306 | Strong upper-end growth |
| Italy | 9 | Avg. $279,439 | Moderate |
| South Korea | 10 | Avg. $311,260 | Leading, >50% since 2020 |
| Switzerland | Reference hub | Avg. $910,382 | Stable |
| Luxembourg | Reference hub | Median $394,005 | High, 13.5% HNWI growth |
| Singapore | Reference hub | High per-capita concentration | Stable |
That gap between size, density, and growth sets up the next issue: what these rankings mean for asset protection, structuring, and mobility.
What These Rankings Mean for Asset Protection, Structuring, and Mobility
Knowing where the most millionaires live gives you context. But if you’re making actual wealth decisions, that isn’t the main thing to focus on. What matters more is what each jurisdiction is set up to do well. The better comparison isn’t just who has the most millionaires. It’s which place is built for growth, which one is better for protection, and which one helps with cross-border flexibility.
Large markets like the U.S. and Germany are built for growth. They have deep capital markets and mature financial systems. That helps with scaling businesses, finding liquidity, and putting money to work at size. The tradeoff is tighter reporting scrutiny and a lot of wealth piled up at the top. The U.S. is very good at creating wealth, but that wealth is also concentrated heavily at the top.
Switzerland, Singapore, and Luxembourg play a different game. They compete on preservation, privacy, and structure rather than total millionaire count.
For investors and globally mobile entrepreneurs, this creates a simple working model: use large markets for growth and liquidity, and use specialized hubs for holding structures, asset protection, and residency optionality. Trusts, holding companies, and LLCs aren’t interchangeable. Each one does a different job.
Seen through that lens, the rankings fall into three broad roles: growth, preservation, and mobility. The table below shows how key jurisdictions line up by function:
| Jurisdiction | Primary Wealth Function | Notable Legal/Tax Feature | Typical Use Case |
|---|---|---|---|
| United States | Capital Growth & Liquidity | Deep capital markets; mature financial system | Operating businesses; high-growth investments |
| Switzerland | Asset Preservation | Highest average wealth per adult at $910,382 | Long-term wealth storage and private banking |
| Singapore | Regional Wealth Hub | Offshore financial center in Asia; tax benefits and privacy | Holding companies; Asian market entry |
| Luxembourg | Institutional Structuring | Highest median wealth at $394,005; highest millionaire density among the analyzed markets | Cross-border fund structuring; family offices |
| Germany | Industrial Operations | Strong export-driven base | Sector-specific operating businesses |
| Canada | Balanced Wealth Distribution | High median wealth | residency and citizenship planning |
The key is to match the jurisdiction to the job. That’s the functional split behind the article’s final takeaway.
Conclusion
These rankings show three different kinds of wealth leadership: total millionaire count, wealth concentration, and growth.
The United States leads the world in total millionaire count at 23,627,000. That’s about 4.5 times more than China. But raw count is only one way to look at wealth. Switzerland leads in average wealth, while Luxembourg leads in median wealth. That’s a different kind of leadership.
Why does that matter? Because wealth leadership can come from scale, distribution, or pace. Growth adds a third layer here. South Korea has posted real average wealth gains above 50% since 2020, and emerging markets still lead real growth.
The U.S. and China hold the largest pools of millionaire capital. Smaller hubs like Switzerland, Luxembourg, and Singapore play a major role in asset protection and privacy. Fast-growing markets like South Korea offer upside tied to faster wealth creation. Each signal points to a different use case, whether you’re thinking about investment focus, diversification, residency planning, or long-term asset protection.
For investors and mobile families, that’s the part that counts. The numbers change. The rule doesn’t: match the jurisdiction to the job.
FAQs
What counts as a millionaire here?
Definitions vary depending on the source, but they all start at a net worth of at least $1 million USD.
UBS uses total net worth. That includes financial assets and non-financial assets, such as real estate, and then subtracts household debt.
Other analyses use a narrower yardstick: liquid investable wealth of $1 million or more. In those cases, a primary residence is often left out.
Why do some rankings differ by source?
Millionaire rankings often vary because each source uses its own method, data set, and reporting window.
They also don’t always measure the same thing. Some focus on liquid investable wealth, while others look at total net worth, including real estate and debt. Rankings can shift due to U.S. dollar currency moves, regional coverage, sample size, and the way each source defines high-net-worth individuals.
Why do median wealth and density matter?
Median wealth and density do a better job of showing what life looks like for the typical person than raw millionaire totals on their own.
A country’s millionaire count can look huge simply because the country itself is huge. Density gives more context by showing how broadly wealth is spread across the population. And when you compare average wealth with median wealth, you get a clearer read on inequality. A big gap between the two usually means a lot of wealth sits with a smaller group of people.
