
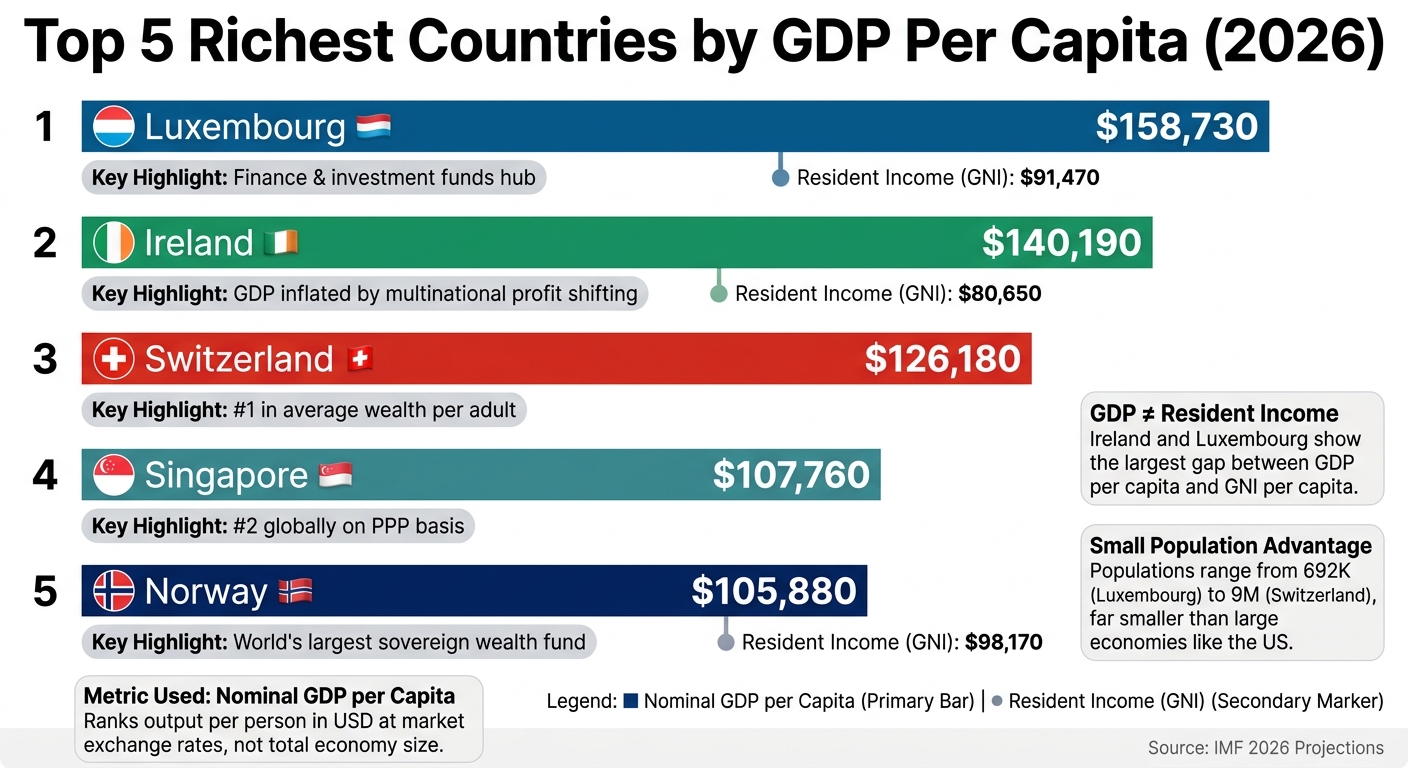
If I rank countries by nominal GDP per capita for 2026, the top five are Luxembourg, Ireland, Switzerland, Singapore, and Norway.
That answer needs one quick note: richest here means output per person, not the largest economy. So this list is not about total GDP. It’s also not the same as PPP, which adjusts for local prices.
Here’s the short version:
- Luxembourg leads at $158,730 per person
- Ireland follows at $140,190, though its GDP is pushed up by multinational profit booking
- Switzerland ranks next at $126,180 and also has very high household wealth
- Singapore comes in at $107,760 and moves higher on a PPP basis
- Norway rounds out the top five at $105,880, backed by oil, gas, and its state fund
The main takeaway: small populations, high-value industries, and global business links help these countries stay near the top.
Quick Comparison
| Country | 2026 Nominal GDP per Capita | What stands out |
|---|---|---|
| Luxembourg | $158,730 | Finance-heavy economy; many cross-border workers |
| Ireland | $140,190 | GDP inflated by multinational profit shifting |
| Switzerland | $126,180 | Strong output plus high wealth per adult |
| Singapore | $107,760 | Trade and finance hub; 2nd on PPP |
| Norway | $105,880 | Oil wealth and the world’s largest sovereign wealth fund |
If you want the plain-English version, I’d say this: these countries are at the top because they produce a lot of value per person, but the headline number does not always match what the average resident takes home.
sbb-itb-39d39a6
How This List Defines ‘Richest Country’
This ranking uses nominal GDP per capita in current U.S. dollars. In plain English, that means a country’s total economic output is divided by its population and then converted at market exchange rates.
For a list like this, that measure makes more sense than total GDP. Total GDP is heavily shaped by population size, so a country can post a giant economy on paper and still not be that wealthy per person.
PPP shows up only when it helps add context. It gives a sense of local buying power, which can tell a different story than market-exchange-rate figures alone.
Ireland is the main exception. Its GDP is pushed up by multinational profit-shifting, which makes the headline number look higher than what residents actually earn. In 2023, its GNI was about 57% of GDP, so GNI per capita gives a more accurate read on resident income.
| Metric | What It Measures |
|---|---|
| Nominal GDP per capita | Average economic output per person in USD |
| PPP-adjusted GDP per capita | GDP adjusted for local prices and cost of living |
| GNI per capita | Income actually earned by residents |
With that definition in place, the list below ranks the five countries that score highest on this measure.
1. Luxembourg
Luxembourg sits at the top of the list, with a projected 2026 nominal GDP per capita of $158,730 and a population of about 692,000. Its small population is a big part of why that number looks so high.
There’s another piece to this, too. Many people commute into Luxembourg from France, Germany, and Belgium for work. They help produce output inside the country, which boosts GDP, but they aren’t counted as residents.
Finance plays a huge role here. Luxembourg is the world’s second-largest investment fund center. Banking, investment funds, and insurance form the core of its economy, and services, mostly finance and fund management, make up about 81% of GDP. A highly skilled, multilingual workforce and a business-friendly regulatory setup help keep that engine running.
That said, GDP per capita doesn’t tell the whole story. In Luxembourg’s case, it makes resident income look higher than it is for the average person living there.
Its GNI per capita is about $91,470, which is much lower than its GDP per capita. Why the gap? Part of the income produced in Luxembourg goes to cross-border workers and foreign firms, not just to residents.
| Metric (2026 Projections) | Value (USD) |
|---|---|
| Nominal GDP per Capita | $158,730 |
| GNI per Capita (Atlas Method) | $91,470 |
| Total Population | ~692,000 |
2. Ireland
Ireland ranks second, with a projected 2026 nominal GDP per capita of $140,190. But there’s an important catch: Ireland’s headline GDP is inflated by multinational profit booking. So if you want a better sense of what people in Ireland actually make, resident income tells you more than GDP alone.
That gap comes from where profits are recorded, not from unusually high local paychecks. Dublin is home to the European headquarters of major companies like Apple, Google, and Meta. Companies such as Pfizer and Microsoft also play a big role. One of the clearest examples came in 2015, when Apple’s IP transfer helped push Ireland’s GDP up by 26% in a single year.
To get a cleaner read on income, economists look at Modified Gross National Income (GNI*). This measure removes much of the effect of multinational profit shifting. By that yardstick, Ireland’s GNI per capita is $80,650. In 2023, GNI came to about 57% of GDP.
That said, Ireland’s economy isn’t just a paper story. It has a strong base, and it keeps growing. In 2025, Ireland exported €260.3 billion in goods, led by pharmaceuticals, technology, and financial services. Its corporate tax setup and highly educated workforce have also helped make it one of the world’s top foreign direct investment destinations. That helps explain why its per-person figures stay high even after this adjustment.
| Metric (2026 Projections) | Value (USD) |
|---|---|
| Nominal GDP per Capita | $140,190 |
| PPP GDP per Capita | $159,130 |
| GNI per Capita (Atlas Method) | $80,650 |
3. Switzerland
Switzerland takes the third spot, with projected 2026 nominal GDP per capita of $126,180. And unlike Ireland, this position comes from strong output in the economy itself, not accounting quirks.
Its total GDP is $1.15 trillion, which puts it 20th in the world. With a population of about 9 million, the country’s output gets spread across a relatively small number of people, which helps push GDP per person higher.
The picture looks just as strong when you look past GDP. UBS places Switzerland first in the world for average wealth per adult, at $910,382. Its median wealth per adult is $145,555, good for 8th worldwide. That matters because it shows this isn’t just a story about big national output on paper. Swiss households also tend to hold large net assets.
A few sectors do a lot of the heavy lifting here:
- Pharmaceuticals
- Precision engineering
- Luxury goods
- Financial services
These industries help explain why Switzerland stays near the top year after year. The country is also the world’s top center for cross-border private wealth management. Add in a skilled workforce, political stability, and high-end exports, and the result is a country with both strong production and deep household wealth.
| Metric (2026 Projections) | Value (USD) | Global Rank |
|---|---|---|
| Nominal GDP per Capita | $126,180 | 4th |
| PPP GDP per Capita | $105,680 | 8th |
| Average Wealth per Adult | $910,382 | 1st |
| Median Wealth per Adult | $145,555 | 8th |
| Total Nominal GDP | $1.15 trillion | 20th |
4. Singapore
Singapore ranks 4th on this list, with projected 2026 nominal GDP per capita of $107,760. That puts it 6th globally.
On a PPP basis, Singapore climbs to 2nd in the world, with GDP per capita estimated at $173,710. The jump makes sense: prices on the ground are lower than in many other wealthy economies, so income goes further.
Population size matters here too. Singapore has just 6.11 million people, which means a lot of high-value output is spread across a relatively small population.
Its position comes from a mix of trade, logistics, and high-value services. About 30% of sea-based trade passes through Singapore, and the Port of Singapore connects more than 600 ports in about 123 countries. Add low taxes, clear rules, and political stability, and it’s easy to see why multinational firms and high-net-worth residents keep coming.
Key industries include:
- Electronics
- Biomedical sciences
- Chemicals
- Financial services
- Wholesale trade
That output also shows up in household wealth, although not evenly. The average wealth per adult is $527,217, good for 6th worldwide. But the median wealth per adult is $96,434, which ranks 20th. That’s a big gap, and it points to wealth being concentrated near the top.
Singapore also keeps drawing investors through its Global Investor Program (GIP). The program grants permanent residency to eligible foreign applicants who invest in businesses, approved funds, or single-family offices.
| Metric (2026 Projections) | Value (USD) | Global Rank |
|---|---|---|
| Nominal GDP per Capita | $107,760 | 6th |
| PPP GDP per Capita | $173,710 | 2nd |
| Average Wealth per Adult | $527,217 | 6th |
| Median Wealth per Adult | $96,434 | 20th |
| GNI per Capita | $74,750 | 10th |
Next is Norway, where resource wealth lifts per-person output.
5. Norway
Norway rounds out the list for a simple reason: its resource wealth lifts output without badly distorting what people actually earn. Its projected 2026 nominal GDP per capita is $105,880, which puts it 7th in the world. On a PPP basis, GDP per capita comes in at $115,550.
What makes Norway stand out is the tight gap between GDP and GNI. Its GNI per capita is $98,170, the highest in the world. That tells you the top-line GDP figure lines up pretty closely with resident income. In plain English, the money showing up in the economy is also reaching the people who live there. It also points to a wealthy economy with a fairly even spread of prosperity.
A big part of that story starts with North Sea oil and gas. But Norway doesn’t treat that income like easy money. Instead, it sends much of the revenue into the Government Pension Fund Global, the world’s largest sovereign wealth fund. The country also sticks to a strict fiscal rule: only about 3% of the fund’s expected annual return can be used in the national budget, which helps protect the principal for future generations.
Norway’s economy isn’t just about energy, either. The country is a major player in seafood, aquaculture, shipping, hydropower, and renewable energy, and it’s also growing its green tech and biotechnology sectors.
Its 5.5 million people also benefit from universal healthcare, education, and a strong social safety net, backed by a progressive tax system.
| Metric (2026 Estimates) | Value (USD) | Global Rank |
|---|---|---|
| Nominal GDP per Capita | $105,880 | 7th |
| PPP GDP per Capita | $115,550 | 6th |
| GNI per Capita | $98,170 | 1st |
| Average Wealth per Adult | $425,391 | – |
| Median Wealth per Adult | $140,003 | – |
Here’s how the five countries compare side by side.
Side-by-Side Country Comparison
Here’s how the five countries line up at a glance. They’re very different in size and economic setup, but they all land near the top for one simple reason: their economies produce a huge amount of output per person.
Population size plays a big role here. The U.S., for example, has the largest economy in the world, but its GDP per capita is lower because that output is divided across a much larger population. That’s why per-person rankings can look very different from total GDP rankings.
| Country | Est. 2026 GDP per Capita (USD) | Approx. Population | Main Economic Driver |
|---|---|---|---|
| Luxembourg | $158,730 | 692,000 | Investment funds and banking |
| Ireland | $140,190 | 5,458,600 | Tech and pharma headquarters |
| Switzerland | $126,180 | 9,007,886 | Banking, wealth management, engineering |
| Singapore | $107,760 | 6,110,000 | Trade, logistics, financial services |
| Norway | $105,880 | 5,630,000 | Oil, gas, sovereign wealth fund |
One thing to keep straight: this ranking is about output per person, not the total size of a country’s economy.
Ireland and Luxembourg also need a bit of context. In both places, GDP per capita can make resident income look higher than it is on the ground, since multinational activity and cross-border workers can skew the numbers.
What These 5 Countries Have in Common
At first glance, these countries don’t seem to belong in the same group. Their size, geography, and economic makeup vary a lot. But under the surface, they share a few structural traits that help explain why they keep showing up near the top of per-capita wealth rankings.
The main thread is specialization. Instead of trying to do everything, each country leans hard into a small number of high-value sectors and backs those sectors with steady policy. In plain English: these economies don’t win on size. They win by being very good at a few things and by sticking to a clear long-term approach.
You can see that pattern pretty clearly across all five. Each country has built strength in a high-value niche:
- Luxembourg leads in funds and banking
- Ireland in tech and pharma
- Switzerland in wealth management and life sciences
- Singapore in trade and finance
- Norway in energy and sovereign wealth
Those niches don’t succeed by accident. They work because the policy backdrop stays predictable. Stable institutions and long-term policy help protect those advantages and draw in capital.
There’s one more catch here, and it matters a lot: the rankings can shift depending on which metric you use. GDP, GNI, and wealth per adult are not saying the exact same thing. Each one highlights a different side of national wealth. That’s especially clear in countries like Ireland, where GDP can make resident income look higher than it is. Ireland is the clearest case: multinational profit shifting inflates GDP, while GNI gives a better picture of resident income.
Conclusion
None of these five countries sits among the world’s biggest economies by total output. But all of them land near the top in GDP per capita. That isn’t random. It comes down to how their economies are set up.
They rank so high because they combine specialization, stability, and global reach. There’s one caveat, though.
The order can move with each IMF update, exchange-rate swings, and population shifts. Ireland is still the clearest example of a country where GDP can overstate the income of people who live there. That’s why this ranking works best as a snapshot, not a permanent order.
On a per-person basis, the richest countries aren’t the largest. They’re the ones that get the most out of small, focused, globally connected economies.
FAQs
Why use nominal GDP per capita?
Nominal GDP per capita measures the average economic output per person. It does this by dividing a country’s total output, based on current market exchange rates, by its population.
It’s a common benchmark for comparing productivity and affluence across countries.
But there’s a catch. This metric doesn’t show how income is split across the population, how much things cost locally, or how much profit multinational corporations move across borders. Because of that, some countries can look richer on paper than they are in day-to-day life.
How does GDP per capita differ from GNI per capita?
GDP per capita measures the total economic output produced within a country’s borders, no matter who earns it.
GNI per capita measures the income earned by a country’s residents. That includes income from abroad and leaves out income sent to people who don’t live in the country. Because of that, GNI per capita is often seen as a better measure of national prosperity.
Does a high GDP per capita mean residents are rich?
Not necessarily. GDP per capita is a common way to measure economic output and average living standards, but it doesn’t mean each person living there is rich.
It simply takes a country’s total output and divides it by its population. That can paint a misleading picture. Why? Because the number can be pulled up by corporate profits, uneven income distribution, and a high cost of living.
If you want a clearer view of how residents are actually doing, it helps to look at metrics like GNI per capita, median income, and social development indicators.
