
The short answer: there is no single “richest” country in 2026. It depends on what I measure.
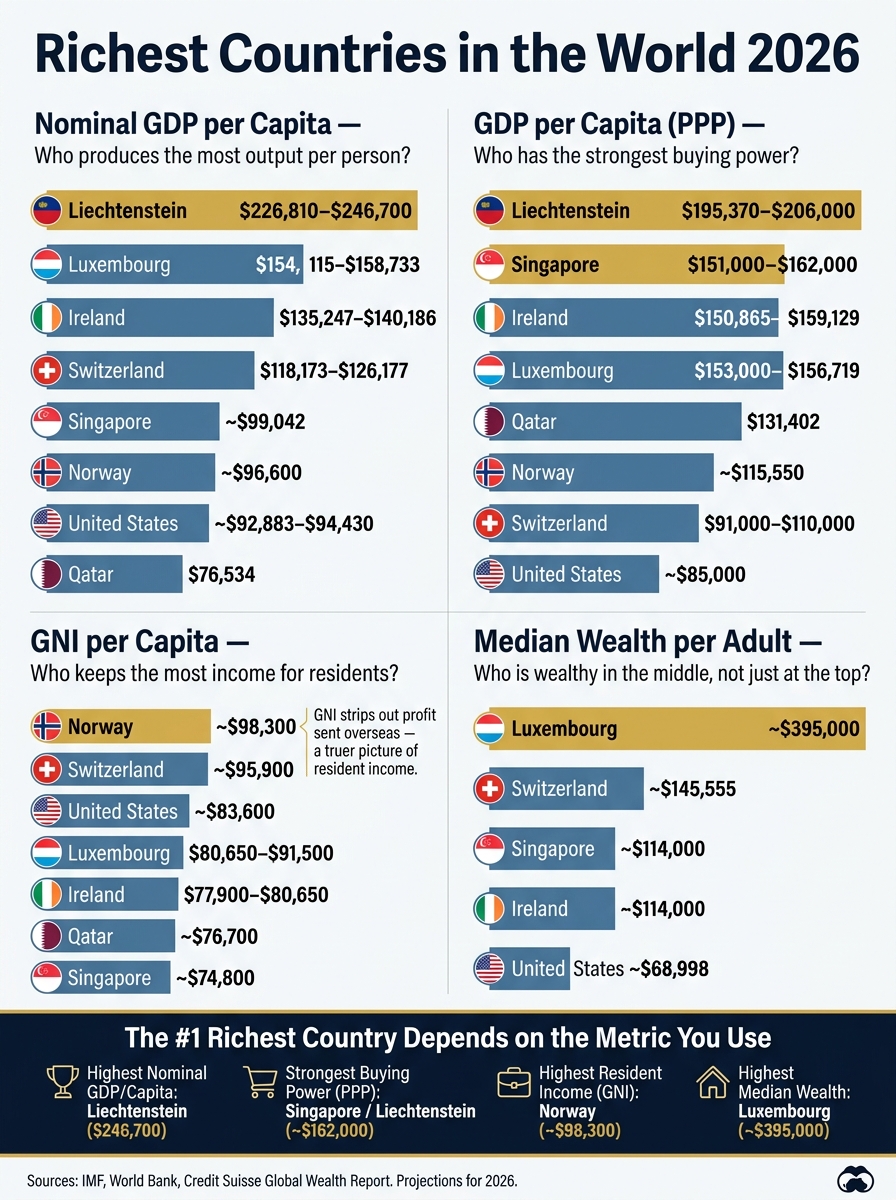
If I use nominal GDP per person, Liechtenstein comes out on top at about $226,810 to $246,700. If I use PPP-adjusted GDP per person, Singapore and Liechtenstein sit at or near No. 1, with Singapore around $151,000 to $162,000 and Liechtenstein around $195,370 to $206,000. If I want a better read on income that stays with residents, Norway stands out with GNI per person near $98,300. And if I care about what the middle household owns, Luxembourg leads this group with median wealth per adult near $395,000.
So if you’re asking, “Which country is richest?”, here’s the plain-English answer:
- Best headline GDP-per-person number: Liechtenstein
- Best buying power: Singapore or Liechtenstein
- Best read on resident income: Norway
- Best median household wealth in this list: Luxembourg
- Biggest economy overall: United States at about $32.38 trillion in 2026
Here are the eight countries covered in the article:
- Luxembourg
- Singapore
- Ireland
- Qatar
- Switzerland
- Liechtenstein
- Norway
- United States
What this means for you is simple: GDP alone can mislead. In places like Ireland and Luxembourg, output per person looks huge, but part of that comes from foreign firms or cross-border workers. In places like Switzerland and Singapore, high income can be offset by high living costs. And in places like the United States and Qatar, national wealth does not mean everyone shares it evenly.
Quick Comparison
| Country | What it stands out for | Main caution |
|---|---|---|
| Liechtenstein | Highest nominal GDP per person | Tiny population and commuter labor can skew the numbers |
| Luxembourg | Very high GDP per person and top median wealth | Cross-border workers inflate per-person output |
| Singapore | Top-tier PPP buying power | High housing costs and income gaps |
| Ireland | Very high GDP per person | GDP is boosted by multinational profit booking |
| Qatar | Strong PPP results from energy wealth | Wealth is unevenly shared |
| Switzerland | High income and high household wealth | Living costs are very high |
| Norway | Strong resident income and a $1.4 trillion+ sovereign wealth fund | High costs and heavy energy exposure |
| United States | Largest economy in the world | Big gap between average and median wealth |
My takeaway: if you want the most useful view, look at four numbers together – nominal GDP per person, PPP, GNI, and median wealth. That gives a much better picture of who is rich on paper, who has stronger buying power, and where residents keep more of the income.
sbb-itb-39d39a6
1. Luxembourg
Luxembourg sits near the top of per-capita wealth rankings in 2026. The reason is simple: the country produces a huge amount of output, and that output is divided across a small resident population. That pushes the per-person numbers sky-high.
Nominal GDP per Capita
Luxembourg’s nominal GDP per capita is projected at $154,115 to $158,733 in 2026, which puts it in the global top tier. That’s about 74% above the EU average. A lot of that output comes from Luxembourg’s banking and fund-management sectors, along with its deep ties to the EU.
There’s also an important wrinkle here. Cross-border workers add to Luxembourg’s GDP, but they aren’t counted in the resident population. So the per-capita figure looks even larger.
GDP per Capita (PPP)
Once you adjust for local prices and purchasing power, Luxembourg’s GDP per capita comes in at about $153,000 to $156,719. That still keeps the country near the top worldwide.
But prices matter. Luxembourg is expensive, so its edge shrinks a bit compared with places where money stretches further. That’s why the order can change when you shift from nominal GDP to PPP and start looking more closely at what residents can actually buy.
GNI per Capita
This is where the story changes a bit. Luxembourg’s GNI per capita is about $80,650 to $91,500, far below its nominal GDP per capita.
That gap comes from two main things:
- A large share of profit made by foreign firms is sent back overseas
- Cross-border workers help produce output but aren’t counted as residents
So while Luxembourg posts huge output numbers, not all of that income stays with residents.
Cost of Living
High output doesn’t mean life is cheap. In 2026, a central one-bedroom apartment in Luxembourg costs about €1,850 per month. At the same time, median wealth per adult is around $395,000, which shows that residents who build wealth often do so at a very high level.
That said, high wealth doesn’t cancel out high costs. And that’s a big reason rankings can look very different once you move past GDP alone.
| Metric (2026 Projections) | Value (USD) | Global Rank |
|---|---|---|
| Nominal GDP per Capita | $154,115 to $158,733 | Top tier |
| GDP per Capita (PPP) | $153,000 to $156,719 | Top tier |
| GNI per Capita (Atlas Method) | $80,650 to $91,500 | Top 10 |
| Median Wealth per Adult | ~$395,000 | #1 |
Singapore shows a different version of the same story: high wealth, but with stronger PPP power.
2. Singapore
Singapore sits below Luxembourg on nominal GDP per capita, but it jumps to the top once you adjust for local prices. In plain English: this is the clearest case in the article where the ranking changes a lot depending on which yardstick you use.
Nominal GDP per Capita
Singapore’s nominal GDP per capita is projected at about $99,042 in 2026, which puts it 6th or 7th in the world. Useful number, yes – but it doesn’t tell the whole story. PPP does.
GDP per Capita (PPP)
On a PPP basis, Singapore moves to the front of the pack. Its PPP-adjusted GDP per capita is projected at $151,000 to $162,000, roughly level with Luxembourg for the #1 spot worldwide.
That jump says a lot. It shows that income in Singapore stretches further at home than the nominal figure alone suggests.
A few things drive that result: trade, finance, efficient regulation, and innovation. Singapore is also projected to be the richest country in Asia and remain in the global top 10 in 2026, ahead of Japan and South Korea in per-person wealth.
GNI per Capita
Singapore’s GNI per capita is about $74,800, which is well below its nominal GDP per capita. The gap matters. It suggests that part of the output produced inside Singapore goes back to foreign firms and investors instead of staying with residents.
Cost of Living
High income doesn’t mean life feels cheap. Singapore comes with real trade-offs, and housing is the big one. Land is limited, demand from local and global buyers is strong, and that pushes prices up.
At the same time, median wealth per adult is around $114,000. But wealth and income aren’t spread evenly. Singapore’s Gini index is 45.9, one of the highest among advanced economies.
| Metric (2026 Projections) | Value (USD) | Global Rank |
|---|---|---|
| Nominal GDP per Capita | ~$99,042 | 6th-7th |
| GDP per Capita (PPP) | $151,000-$162,000 | 1st-2nd |
| GNI per Capita (Atlas Method) | ~$74,800 | Top 15 |
| Median Wealth per Adult | ~$114,000 | – |
Ireland shows an even wider gap between headline GDP and resident income.
3. Ireland
Ireland sits near the top of global GDP-per-capita rankings. But there’s a catch: a lot of that output is tied to multinational profit booking, which makes the country look richer on paper than many residents feel in day-to-day life.
Nominal GDP per Capita
Ireland’s projected 2026 nominal GDP per capita is between $135,247 and $140,186, which puts it 3rd or 4th in the world. A big reason is that companies like Apple, Google, Meta, and Pfizer book profits through their Irish headquarters.
That pushes GDP higher. But it doesn’t mean Irish households see income rise at the same pace.
GDP per Capita (PPP)
On a purchasing power basis, Ireland’s GDP per capita climbs to $150,865 to $159,129, keeping the country in the global top 3. Even then, the number is still heavily shaped by multinational profit flows instead of money that actually lands with residents.
Put simply, the headline figure and lived income are not the same thing. The gap between Ireland’s apparent economic output and the income actually available to residents is more than $70,000 per person.
GNI per Capita
If you want a better read on resident wealth, GNI tells a clearer story. Ireland’s GNI per capita (Atlas method) is approximately $77,900 to $80,650, which ranks it around 7th globally. That’s roughly half of its PPP-adjusted GDP figure.
Ireland’s central bank also created Modified GNI (GNI*) to strip out distortions caused by multinational accounting. That alone tells you how unusual Ireland’s data can be.
Cost of Living
High income figures don’t automatically mean life feels cheap. In Dublin, a central one-bedroom apartment averages about €1,850 per month. Median wealth per adult is approximately $114,000.
| Metric (2026 Projections) | Value (USD) | Global Rank |
|---|---|---|
| Nominal GDP per Capita | $135,247 – $140,186 | 3rd – 4th |
| GDP per Capita (PPP) | $150,865 – $159,129 | Top 3 |
| GNI per Capita (Atlas Method) | $77,900 – $80,650 | ~7th |
| Median Wealth per Adult | ~$114,000 | – |
Qatar shows a different wealth pattern: lower nominal GDP per person, but very strong purchasing power.
4. Qatar
Unlike Ireland, Qatar gets its wealth from energy exports, not profit booking. The economy runs mainly on LNG and oil, with support from a population of about 3 million. The country is branching out into other sectors, but energy still does most of the heavy lifting when it comes to national income.
Nominal GDP per Capita
Qatar’s projected 2026 nominal GDP per capita is $76,534, which puts it 13th in the world. That’s a high figure by any standard. But on its own, nominal GDP per capita doesn’t show what day-to-day spending power looks like inside the country.
GDP per Capita (PPP)
This is where Qatar jumps. When adjusted for purchasing power, GDP per capita climbs to about $131,402, placing Qatar around 3rd globally.
That difference matters. It shows that income stretches further inside Qatar than the nominal number suggests. If you want the clearest picture of what money can actually buy at home, PPP tells the better story here.
Qatar also ranks 2nd globally in wealth per hour worked at about $111,000, adjusted for PPP and hours worked.
GNI per Capita
Qatar’s GNI per capita is about $76,700, which is very close to its nominal GDP per capita. That’s a sharp contrast with Ireland, where GNI comes in much lower than GDP. In Qatar’s case, the two figures line up closely, which points to less leakage.
Cost of Living
Qatar’s lower domestic cost of living, compared with many other high-income countries, helps explain why its PPP figure jumps so much above its nominal one.
Still, the headline numbers don’t tell the whole story. Qatar is rich, but that wealth isn’t spread evenly. Income is split unevenly between citizens and migrant workers.
| Metric (2026 Projections) | Value (USD) | Global Rank |
|---|---|---|
| Nominal GDP per Capita | $76,534 | 13th |
| GDP per Capita (PPP) | $131,402 | 3rd–7th |
| GNI per Capita (Atlas Method) | ~$76,700 | Top 15 |
| Wealth per Hour Worked (PPP) | $111,000 | 2nd |
Qatar ranks much higher on PPP than on nominal GDP, but the gains are not shared evenly.
Switzerland takes a different path to wealth, built more on finance and industry than energy.
5. Switzerland
Switzerland builds wealth through finance, pharmaceuticals, and precision manufacturing. Its political neutrality and steady policy backdrop help attract long-term investment. And unlike places like Luxembourg and Singapore, high income alone doesn’t tell the whole story here. Switzerland is expensive, so what people can actually buy with that income matters a lot more.
Nominal GDP per Capita
Switzerland’s projected 2026 nominal GDP per capita comes in between $118,173 and $126,177, which puts it at roughly 3rd to 5th in the world. That level is driven by finance, life sciences, and high-value manufacturing.
GDP per Capita (PPP)
PPP gives a more grounded view because prices in Switzerland are so high. Once adjusted for purchasing power, GDP per capita drops to about $91,000 to $110,000, which moves Switzerland down to around 5th to 9th globally.
That shift makes sense. Zurich rents often run above CHF 3,000, and healthcare, childcare, and transportation are expensive too. So if you’re trying to judge what Swiss income actually buys day to day, PPP tells the better story.
GNI per Capita
Switzerland’s GNI per capita is about $95,900, which sits close to its GDP per capita. That usually points to lower profit leakage and more income staying with residents.
Cost of Living and Wealth Distribution
Switzerland also stands out for household wealth, but the split between average and middle-of-the-pack households is hard to miss. Average wealth per adult is $910,382, while median wealth is about $145,555.
That gap shows how a country can post very high national income numbers without spreading prosperity evenly across the population.
| Metric (2026 Projections) | Value (USD) | Global Rank |
|---|---|---|
| Nominal GDP per Capita | $118,173 – $126,177 | 3rd – 5th |
| GDP per Capita (PPP) | $91,000 – $110,000 | 5th – 9th |
| GNI per Capita (Atlas Method) | ~$95,900 | 2nd – 4th |
| Average Wealth per Adult | $910,382 | 1st |
| Median Wealth per Adult | ~$145,555 | 8th |
High income, high costs, and strong resident wealth make Switzerland a different kind of wealth leader. Liechtenstein takes that pattern even further.
6. Liechtenstein
Liechtenstein takes the microstate wealth story to another level. In 2026, it is projected to rank 1st in the world for both nominal GDP per capita and GDP per capita (PPP). A very small population, plus a large commuter workforce, helps push its per-person numbers sky-high. The economy leans on private wealth management, financial services, and precision manufacturing. It also gets help from a 12.5% corporate tax rate, low personal taxes, and near-zero public debt.
Nominal GDP per Capita
Liechtenstein’s projected 2026 nominal GDP per capita is about $226,810 to $246,700, which puts it 1st globally. That is far above Luxembourg, which ranks next at about $154,100 to $158,730. For context, the United States is projected at about $94,430 per person.
That headline number is striking. But there’s a catch: it doesn’t automatically tell you what the average resident takes home.
GDP per Capita (PPP)
On a purchasing power basis, Liechtenstein still ranks 1st globally, at about $195,370 to $206,000. Because local prices are high, PPP gives a better sense of day-to-day buying power.
GNI per Capita
GDP can overstate resident income in Liechtenstein because many workers commute in from other countries. They add to output, but they do not live there. That’s why GNI per capita is a better check on what residents themselves are earning.
| Metric (2026 Projections) | Value (USD) | Global Rank |
|---|---|---|
| Nominal GDP per Capita | $226,810 – $246,700 | 1st |
| GDP per Capita (PPP) | $195,370 – $206,000 | 1st |
7. Norway
Norway got rich from oil and gas. But the part that stands out is what it did next: it parked much of that money in the Government Pension Fund Global, the world’s largest sovereign wealth fund, now worth more than $1.4 trillion. That makes Norway a strong example of how a country can turn resource income into day-to-day prosperity for residents.
Nominal GDP per Capita
In 2026, Norway’s projected nominal GDP per capita is about $96,600, which puts it around 7th or 8th in the world.
GDP per Capita (PPP)
Norway’s GDP per capita (PPP) is about $115,550, good for roughly 6th place globally.
GNI per Capita
Norway’s GNI per capita is about $98,300. That’s the highest in this group, and it’s close to the country’s GDP per capita. That gap matters. It suggests less profit leakage than in places like Ireland or Luxembourg. In plain English, Norway’s income figures line up more closely with what residents and the domestic economy actually keep. That’s part of why the country ranks so high without leaning on profit-booking effects.
Cost of Living
Norway is expensive. Still, high wages and universal public services help take some of the sting out of those costs.
| Metric (2026 Projections) | Value (USD) | Global Rank |
|---|---|---|
| Nominal GDP per Capita | ~$96,600 | 7th–8th |
| GDP per Capita (PPP) | ~$115,550 | ~6th |
| GNI per Capita (Atlas) | ~$98,300 | Highest in this group |
Next is the United States, where scale matters more than per-person wealth.
8. United States
Unlike the microstates above, the U.S. gets into the top tier partly because of sheer size, not just high income per person. It is still the world’s largest economy by total output, with projected nominal GDP of about $31.8 trillion in 2026. That’s roughly one-quarter of global output.
On a per-person basis, though, the picture shifts a bit. The U.S. ranks around 8th–9th in nominal GDP per capita, behind smaller places like Luxembourg, Singapore, and Ireland.
Nominal GDP per Capita
Projected U.S. nominal GDP per capita in 2026 is about $92,883 to $94,430. One detail stands out: the U.S. is the only economy with a population above 10 million to place in the global top 10 for GDP per capita.
GDP per Capita (PPP)
On a PPP basis, U.S. GDP per capita is around $85,000. That number is still high, but steep costs for housing, healthcare, and education eat into part of that buying-power edge.
GNI per Capita
U.S. GNI per capita is about $83,600. The close gap between GDP per capita and GNI per capita points to a broad domestic economy rather than heavy profit shifting. That sets the U.S. apart from places like Ireland or Luxembourg, where GDP and resident income can differ a lot.
Cost of Living
The bigger issue here is distribution. National averages can look strong while many households feel far less wealthy in day-to-day life. The U.S. has a relative poverty rate of 18%, and wealth is heavily concentrated: average wealth per adult is $696,277, while median wealth is $68,998.
| Metric (2026 Projections) | Value (USD) | Global Rank |
|---|---|---|
| Nominal GDP per Capita | ~$92,883–$94,430 | 8th–9th |
| GDP per Capita (PPP) | ~$85,000 | – |
| GNI per Capita (Atlas) | ~$83,600 | 7th |
| Average Wealth | $696,277 | 2nd |
| Median Wealth | $68,998 | 28th |
That gap between average and median wealth helps explain why no single measure tells the whole story.
Strengths and Limits of Each Wealth Leader
Each country sits near the top for a clear reason. But GDP on its own doesn’t tell the whole story. Once you switch to GNI, PPP, or wealth distribution, the picture changes fast.
That’s the point of the table below: it shows why rankings move around and what each metric shows that GDP alone can miss.
| Country | Key Strengths | Key Limitations | What GDP Misses |
|---|---|---|---|
| Luxembourg | Global financial hub; highest median wealth per adult ($395,000) | Cross-border labor inflates GDP | GNI per capita is about $91,500, well below GDP per capita |
| Singapore | Leading trade and logistics hub; PPP-adjusted GDP per capita of $151,000–$162,000 | High inequality and high living costs reduce the benefit of top-tier income | Heavy reliance on private spending for healthcare and housing |
| Ireland | Tech and pharma FDI powerhouse; high goods exports (~€260B) | GDP is inflated by multinational profit booking, so it overstates resident income | Much of the headline output never reaches residents |
| Qatar | Massive natural gas and oil reserves; high PPP-adjusted income | Wealth is split unevenly between citizens and migrant workers | PPP is strong, but gains are uneven |
| Switzerland | Political stability; renowned banking sector; average annual earnings above $104,000 | High living costs reduce real spending power | High private costs for healthcare and real estate blunt actual spending power |
| Liechtenstein | Sophisticated private wealth services; high-tech industrial excellence | A tiny domestic base and heavy commuter labor can distort the numbers | Limited domestic market; high dependence on foreign labor |
| Norway | Highest GNI per capita in this group (~$98,300); $1.4T+ sovereign wealth fund | High personal income taxes; prosperity is heavily tied to energy exports | Everyday goods are expensive despite strong headline income |
| United States | Only large-scale economy in the top tier; deep capital markets; innovation in AI and biotech | 18% relative poverty rate, the highest among advanced peers | Median wealth trails average wealth by a wide margin |
A few patterns stand out.
Luxembourg looks unbeatable on GDP per capita, but that number gets pushed up by commuters who work there and live elsewhere. So the country is rich, no doubt, yet resident income looks less extreme when you shift to GNI.
Singapore and Switzerland show another issue: high income doesn’t always mean easy day-to-day living. If housing, healthcare, and other basics eat up a big share of income, top-line output starts to feel less impressive.
Ireland is the clearest case of GDP distortion. A lot of output comes from multinational accounting and profit booking, which makes GDP look larger than the income that actually stays with residents. On paper, it can look like a giant. On the ground, the story is more mixed.
Qatar and the United States highlight the distribution problem. A country can post huge numbers and still leave a lot of people far from that headline wealth. That gap matters if you’re trying to measure how rich a place feels in ordinary life, not just in national accounts.
Norway and Liechtenstein remind us that scale matters too. Norway pairs very high income with a massive sovereign wealth fund worth more than $1.4 trillion, while Liechtenstein posts striking numbers partly because of its tiny size and heavy use of foreign labor. In small states, per-capita figures can swing hard.
Put simply, the richest country depends on what you’re measuring. GDP can show output. GNI gets closer to resident income. PPP adjusts for local prices. Wealth distribution shows who actually shares in the gains.
Conclusion
The answer changes depending on the metric.
No single country comes out on top across the board. Liechtenstein leads in nominal GDP per capita at about $246,700. Singapore ranks first on the PPP-adjusted list at $151,000–$162,000. Norway has the highest GNI per capita in this group at about $98,300. And Luxembourg leads in median wealth per adult at around $395,000. Put simply, the top spot moves when the yardstick changes.
That’s why GDP by itself doesn’t tell the whole story. It measures output, but it doesn’t always reflect what residents actually have. In the U.S., average wealth per adult is $696,277, while the median is about $68,998. That gap says a lot. National averages can look huge on paper while the typical household sees something very different.
So it helps to treat these rankings as a starting point, not the final word. If you’re weighing where to live, work, or invest, compare nominal GDP per capita with PPP, GNI, and median wealth. That gives you a much clearer view of what prosperity looks like in practice. The richest country depends on what you mean by richest: output, resident income, buying power, or household wealth.
FAQs
Why isn’t there one richest country?
There’s no single richest country because “richest” depends on how you measure it. And those measures don’t mean the same thing.
The United States leads in total GDP. But smaller countries like Luxembourg or Singapore often rank higher in GDP per capita or GNI per capita.
The picture can shift again when you look at PPP or broader quality-of-life measures. In plain English: one country can have the biggest economy, while another may look richer on a per-person basis.
What’s the difference between GDP, PPP, and GNI?
GDP per capita measures the output produced inside a country’s borders. But there’s a catch: it can look higher or lower because of foreign company activity.
GNI per capita focuses on income earned by a country’s residents. That includes money coming in from abroad and leaves out profits that go to people or firms outside the country.
PPP adjusts GDP or GNI based on local prices and cost of living. In plain English, it shows what that income can actually buy, which gives a better picture of living standards.
Which measure best shows real living standards?
No single metric can perfectly show living standards. But PPP is widely seen as the best way to compare what people in different places can actually afford.
That’s because PPP-adjusted GDP per capita factors in local prices and inflation. So it gives a clearer picture of purchasing power than nominal figures, which can look neat on paper but often miss what day-to-day life costs.
If you want a fuller picture of prosperity, it also helps to look at GNI per capita, income distribution, and human development indicators.
